Shear pin analysis using FEA

shear_pic-00

Shear load comparison (real test vs FEA)

It is interesting to see how does wellhead tooling mechanism works on installing & retrieving wellhead (and associated components) in the field embodied in simple mechanical design that we might find in our daily life. Shear pin is one of component that widely used in tooling which offer big contribution on many wellhead components installation. The name shear pin is associated with any simple (tiny) geometry to be sacrifice by shearing act. Based on how the way it works, it reminds us on small part that we can find at plunger lock / door latch, it just that this pin was functioned to be sheared-off, while home door for latching purpose.

shear_pic-01

Figure 1 – Door latch

Design & simulation

Designing the shear pin is not so difficult as we expect the pin to fail. However, few other things might complicate the design when we have challenges, such as: space, material, and possibly machining tolerance between all contact parts.

In the study, simulation was performed with design simplification to mimic the real shear pin design. The pin was simulate using soft steel material with yield strength 370MPa [53,000 PSI] housing on rigid body with yield strength 724MPa [105,000PSI]. The pin was loaded by rigid dummy box that gives 26,689N [6,000lbf] downward input force as per maximum load design intention.

Analysis was performed in 3D half symmetric implicit as the simulation result won’t be affected by cutting the model to half. Both housing and pin were assigned as deformable model, while dummy box assigned as discrete rigid considering the function as to provide downward load without expecting any deformation. On boundary condition setting, dummy box was constrained in Y-axis movement, housing was encastre, and additional constraint need to set on symmetric place to constraint in Z-axis, X-rotational axis, and Y-rotational axis.

shear_pic-02

Figure 2 – Shear pin FEA model

One thing to highlight from this test is how the pin was shear-off. There are two possibilities how pin might shear depend on the area on which load shall act parallel onto it, either direct shear or (half) angle shear [1], whichever is smaller. Hence, during design stage, it is worth to perform calculation to determine both shear area value.

shear_pic-03

Figure 3 – Typical shear area

Simulation result shows that pin was having 26,418N [5,939lbf] load transferred from the dummy box with several area show plastic deformation designated by gray color. Other than obvious massive deformation, several area also start yielding. This yielding (red color) was expected and shall be checked in the real test. However, the simulation result doesn’t indicate whether the pin was having direct shear or angle shear.

shear_pic-04

Figure 4 – FEA simulation result

Design validation

Moving on to validation phase, design was finally tested on the real setup as part of wellhead tooling equipment. The pin was able to shear at load 18,798N [4,226lbf] as per design intention. Shearing act was occur at the angle cross section. Several yielding was observed as per simulation result and this is considered acceptable since the pin was able to shear without roll-over and damage other part, i.e. housing, and all contact parts are still intact.

shear_pic-05

Figure 5 – Test result

Conclusion

Few things worth to highlight:

  1. Shear pin simulation proof that FEA help to support design activity by reducing R&D effort in term of time & cost.
  2. Pin was designed as sacrificial part and expect to shear without damaging other parts. The notch profile helps to locate the expected location of shear damage.
  3. Shearing failure might occur in angle cross section, not direct shear depends on shear area, whichever is less.
  4. Material hardness are one of important parameter at shear pin design. As the intention of sacrificing the pin without damage other parts, pin material needs to be softer than the housing. In this case, pin was having ~15HRC hardness difference against housing material.

Reference

[1]. Fowler, John, “Design Handbook for API6A/16A/17D Equipment”, 9th Edition, Houston, Texas, September 2011.

Posted in Engineering | Tagged , , , , , | 2 Comments

Load transfer in mechanical design

fig0-cover

In general, mechanical system design which consists of multi bodies shall have to consider load transfer aspect. Load transfer is one of basic topic that was known among (mechanical) engineering student. Most engineering student knew load transfer as a manifestation of Newton third law of motion:

For every action, there is an equal and opposite reaction.

Load transfer commonly discussed in wellhead component design, i.e. casing hanger in conventional wellhead. Consideration of this aspect shall serve as a systematic design basis of the well barrier element. Insufficient attention against load transfer might cause misleading information during well operational lifetime which will lead to catastrophic failure in extreme. Some study mention that 14% of 309 wells checked had well integrity problems in which systematic approach hasn’t properly exercised during design phase[1]. This study will observe casing hanger that suspend oil well casing strings and the impact of transferring load onto wellhead spool by using both hand calculation and FEA approach.

Force equilibrium analysis using hand calculation

As explained earlier, casing hanger load transfer in conventional wellhead can be solved by using force equilibrium analysis with simple Free Body Diagram (FBD). The layout was simplified for this study, since point of interest located at interaction between two (2) bodies, body that represent conventional spool wellhead and plug which represent casing hanger.

During FBD, force equilibrium analysis shall include friction force which exists on each body contact. There are three (3) cases performed on this study with original force 1,000lbf vertical load transferred through varying seat angle shoulder (a) at 30°, 45°, and 60°. Moreover, since the equilibrium analysis include friction force (f), each particular seat angle case shall expand with known friction ranging from 0 to 1 in 0.2 increment.  The result was tabulated and graphed as below.

fig1-load_transfer_case_simplification

Figure 1 – Load transfer case simplification

fig2-fbd_hand_calculation

Figure 2 – Free body diagram hand calculation

fig3-hand_calculation_result

Figure 3 – Hand calculation result tabulation

Result shows that normal force (R) will decrease with increasing seat angle (a). It means that normal force will decrease given there’s more contact area (see graph R vs f). More contact area shows better load transfer since it will reduce normal force and helps to fully transfer original load to another body (see graph Ry vs f).

Force equilibrium analysis using FEA

Force equilibrium analysis shall be verified using Finite Element Analysis (FEA) software, Abaqus 6.13-1. This practice also demonstrate how FEA method can be applied to solve simple force equilibrium analysis using axisymmetric element (2D analysis), instead of advance analysis in which the software was aimed for.

In this study, casing hanger load transfer case modelled as plug against taper shoulder. The hanger (plug) set as analytical rigid body and wellhead body set as deformable body. Analytical rigid body was selected since the plug assumed has no deformation, while wellhead body might deform with higher load. AISI 4130 87k yield elastic-plastic material was assigned for wellhead body (see previous post on Linkedin or WordPress for material properties details).

Mesh convergence wasn’t performed in this study. Instead, finer mesh was applied at taper contact line. CNF, CNF1, and CNF2 parameter shall be observed on each FEA study. CNF (or CNORMF) is one of contact output variable that signify how load transferred from body to body in nodal point while CNF1 & CNF2 belong components of CNF in x-axis and y-axis, respectively. The result was tabulated and graphed as below. The total load transfer was taken from the summation of those values that acted on each node.

fig4-fea_result_45deg_f02

Figure 4 – FEA result at 45° seat angle with 0.2 friction coefficient

fig5-fea_result

Figure 5 – FEA result tabulation

FEA result shows ‘almost flat’ curve of load transfer on each seat angle with various friction coefficient at both CNF and CNF1 parameter. This result indicates losses due to friction are safe to be neglected. Another interesting result is original external load (Fv) are fully transferred to another body regardless various seat angle and friction coefficient (see graph CNF2 vs f).

Result comparison and summary

Both studies have performed in a similar way and show different output. All discrepancies are calculated for each case and shown at below figure. Sample study case at seat angle 30° plot in the same scale for better visual comparison.

fig6-result_error_comparison

Figure 6 – Result error comparison

This study can be summarized as per follow:

  1. The study is inconclusive since those result comparisons gave high error percentage. Hand calculation results consider friction force as considerable losses, while in FEA study, friction losses is negligible.
  2. Successful comparison of this study only occurs at each seat angle case with zero friction coefficients.
  3. Intuitively speaking, FEA give more sense result as friction coefficient doesn’t give major impact on load transfer aspect. However, further and detail study and/or experiment need to be exercised to validate those result. Additional aspect such as surface roughness, coating on real experiment will definitely give some contribution on load transfer aspect.

  Reference:

  1. Okstad, Eivind H., Sangesland, Sigbjorn: “Integrity Assessment of Well Barrier Threatened by Increasing Casing Hanger Load”, Paper SPE 105615 prepared for presentation at the 2007 SPE E&P Environmental and Safety Conference held in Galveston, Texas, USA, 5-7 March 2007.
  2. Fowler, John, “Design Handbook for API6A/16A/17D Equipment”, 9th Edition, Houston, Texas, September 2011.
Posted in Engineering | Tagged , , , , , , , , , , , , , , , , , , , , , , , , , , , , | Leave a comment

Pressure VS Concentrated Force comparison (with Continuum Distributing Coupling) in Finite Element Analysis

Pressure [PSI] is one of mechanical loading that normally applied on Static stress/displacement analysis. One of the benefits by applying pressure is simplicity for applying uniform distributed load in the normal direction of the surface. However, many mechanical static analysis books were using force [lbf] more often than pressure [PSI]. By nature, force is a single mechanical load acting at a single point (concentrated), which make it less appealing option to use in FEA.

Fortunately, there’s what so called coupling constraint feature in FEA software that allow treatment of surface as represented by a single point (node). By using this constraint, an area of surface might be exposed with same loading on behalf of concentrated force applied on a single node.

Finite element analysis using Abaqus 6.13-1 shall be performed on simple steel block under pure tension, both in terms of pressure and force (with continuum distributing coupling constraint) to compare behavior between these two loadings. The steel block has dimensions 1” x 1” x 5” which fixed at one end while tensioned at the other end. Such dimension was chosen for the sake of area calculation simplicity.

Steel block material being made of heat treated low alloy steel AISI 4130 with 87,000PSI yield strength (normalized 1,652°F; quench 1,625°F; temper 1,247°F). Plasticity data was taken from tensile test experiment (*).The block was seen in cut into four (4) section as partition in order to give reference point for concentrated force application.

Figure 1 – Steel block (1” x 1” x 5”) with AISI 4130 material

As an effort to validate FEA result accuracy, mesh convergence test was performed by observing maximum Von Mises (S) value against number of mesh element on components. FEA error also computed to signify how close the current result as compare to prior result.

Mesh convergence test performed at case with pressure load 80,000PSI and elastic-plastic material properties. Additional analysis also performed by using elastic material properties for comparison. Mesh verification was performed as well to determine mesh element quality. It shows that elastic-plastic approach gave stable and convergent result rather than elastic approach. Hence, material with elastic-plastic properties shall be used for comparison between pressure and force load.

Figure 2 – Mesh convergence test with elastic-plastic material property

Figure 3 – Mesh convergence test result with 80,000PSI pressure load

Comparison between pressure and force load with continuum distributing coupling was performed at three (3) input load: 20,000; 40,000; and 80,000. The load magnitude might be expressed in terms of pressure unit [PSI]  or force unit [lbf] since it share same magnitude considering the area at top side is 1inch2. Simulation results were shown in cut section to show internal loading of the block.

Figure 4 – Simulation result with load input 20,000PSI (lbf)

Figure 5 – Simulation result with load input 40,000PSI (lbf)

Figure 6 – Simulation result with load input 80,000PSI (lbf)

Figure 7 – Simulation result comparison

It appears that force load with continuum distributing coupling constraint has similar result with simulation under pressure load. On the internal cut visualization, both simulations also show similar stress profile.

This simulation shows that there’s another option for applying mechanical uniform loading in finite element analysis instead of pressure. Concentrated force with additional continuum distributing coupling constraint might give similar result in the event that only force loading known instead of pressure. Another fact that might be acquired from this simulation is regarding material plasticity. Given there’s simulation using steel material with available material test data, plasticity aspect shall provide more logical result against pure elastic to account unexpected deformation.

Reference:

  1. Abaqus 6.14 Analysis Users Guide sec. 35.3.2 – Coupling Constraints – Distributing Coupling Constraint online manual. Retrieved from sharcnet.ca/Software/Abaqus/6.14.2/v6.14/books
  2. Zareh, Hormoz (2011). Abaqus/CAE (ver 6.10) Material Nonlinearity Tutorial. Retrieved from ewp.rpi.edu/hartford/~biehla/FWLM/Project/References.
  3. Skotny, Łukasz (2017, June 6th). When to ignore material nonlinearity? Retrieved from com/when-ignore-material-nonlinearity/.
Posted in Engineering | Tagged , , , , , , , , , | 3 Comments

Is there any gap in face-to-face 6BX flange / 16BX hub connection?

fig1-ring_gasket_gap

One time, I was monitoring how the wellhead technician make-up flange connection to compress a (brand new) ring gasket. The make-up process started with stud being torque up to recommended value in criss-cross manner to mate 2 (two) flanges end connection bodies with ring gasket in-between. The ring gasket then being compressed to perform sealing act. Once all been set, intuitively we wouldn’t see any gap between those mating connections. However, the gap’s still there as I can see it with naked eye though I didn’t have proper gage to quantify how much visible gap there.

This confusion reminds me back to the similar case that I heard during my discussion with another colleague. It turns out that this is not something new among people who had hands-on skill for make/break flange connections. This fact also has been dictated in API standard.

Face-to-face contact is not necessary for the proper functioning of type 6BX flanges. [1] Clause 10.1.2.3.1

This is what intrigues me to start my small investigation using finite element method (FEM) to see how much gap left after ring gasket compressed. I did my simulation for API 16A hub connection since I knew both 6BX flange and 16BX hub share the same ring gasket mate. Another reason is because we couldn’t get visual on hub connection once we tighten all the studs. You can see the details here (just skip it if you’re not familiar or interested with FEM).

In the simulation, I took a contact pressure parameter prior to check on displacement as assurance that the ring gasket has been set to seal. The contact pressure developed at ring gasket requires minimum 3 (three) times working pressure in order to be able to perform sealing act [2]. Based on this small investigation, I found there’s still some gap about 43mil [1mm] left once the seal has been set. This result also proves that same idea also applies to hub connection instead of flange connection.

Visible gap on BX-160 ring gasket 16BX hub connection

Reference

  1. API Specification 6A, Specification for Wellhead and Christmas Tree Equipment, 20th Edition, October 2010.
  2. Milberger, L.J; A.Radl; “Evolution of Metal Seal Principle and Their Application in Subsea Drilling and Production”, OTC 6994, presented at the 24th Annual OTC in Houston, Texas, May 4-7, 1992.
  3. API Specification 16A, Specification for Drill-through Equipment, 3rd Edition, June 2004.
Posted in Engineering | Tagged , , , , , , , , , , , , , , , | 3 Comments

Know Galling Further on Stainless Steel Fastener

galling_cover

(Adapted from [1] page 2 edited)

Stainless steel fasteners are a common mechanical joint that used in many industries. Typically, stainless steel is selected due to corrosion resistance feature, instead of mechanical properties required. Apart from these commercial reasons for selecting stainless steel, there is another risk need to be considered by engineer during material selection phase regarding possible failure such as galling.

Galling is a kind of non-abrasive wear phenomena that characterized by metal joining due to adhesion between rubbing surfaces. ASTM G40 [2] classified galling failure as a non-abrasive wear since the wear failure does not intentionally contain abrasive medium. Galling was triggered by mating of metal surface followed by static loading. The static loading shall push material to increase surface contact area in order to support the load. During mechanical joint (sliding) process (e.g. thread joint), material was moved relative to the other mating material surface under static loading. The sliding motion combine with load are likely to cause localized material adhesion, similar like what happen on cold welding.

One of the reason galling thread failure was happen due to improper thread joint material combination, especially at self-mating combination which common occur at austenitic stainless steel (300series). Austenitic stainless steel is a family of stainless steel which has FCC (face center cubic) atom lattice structure with high work hardening rate. Such atom arrangement structure has benefit in terms of good formability. Unfortunately, this atomic structure also made the material can only be modified by cold work (work hardening), not by heat treatment. The high work hardening rate indicates the material easily hardened (higher yield, tensile strength) with the expense of decreased ductility, which explain why thread galling failure happen on self-mate austenitic stainless steel material.

Another factor that drives thread galling failure might come from thread machining process, less thread clearance, lubrication issue, or even inappropriate service condition. Problems related to machining process are resulted from poor surface roughness, especially on female (nut) threading process. Female threads (nut) are most likely made by cutting process, while male threads (bolt) can be formed either by cutting or rolling. The latter process is more beneficial since it will offer better fatigue life. On the other hand, insufficient clearance on the rubbing surface will prevent wear debris displacement and promote galling.

Material resistance against galling normally measured as galling threshold stress under specific material combination, either self-mate or different material couple. ASTM has been developing standard test (ASTM G98 [3]) since 1950 to determine galling resistance by using the button-on-block test. However, those test doesn’t reflect how galling occur at thread joint, which make industry (like oil drilling industry) to develop what so called make/break test to simulate actual galling failure on thread joint. These tests are beneficial, but very expensive to perform. Hence, button-on-block test still used as screening test to determine material suitability against service condition of a particular application.

Here is some of threshold galling stress (TGS) data that obtained through button-on-block test for both similar and dissimilar-mated on selected stainless steel. Some of the fact that worth to note at self-mated stainless steel such as martensitic (heat treat hardenable) stainless steel shall have a higher threshold as the hardness increase. Increased aging temperature on precipitation hardened stainless steel may decrease galling resistance. Dissimilar mated test result suggests that TGS value might change due to different material condition. Above all the fact observed, S21800 (Nitronic® 60) might be considered as the most galling resistant stainless steel based on several combination mentioned.

TGS Result for Selected Similar Stainless Steel on Same Condition [5] p.1472 Table 10

Stainless Steel

Family

UNS Number Condition Hardness Threshold Galling Stress

[PSI]

Martensitic S41000 Annealed 87HRB 1,000
Martensitic S41000 Tempered at 500ºF 43HRC 3,000
Precipitation Hardened S17400 Aged at 895ºF 45HRC 10,000
Precipitation Hardened S17400 Aged at 1150ºF 34HRC 5,000
Austenitic S31600 Annealed 82HRB 7,000
Austenitic S31600 Cold drawn 27HRC 5,000
Austenitic S21800 Annealed 92HRB 15,000
Austenitic S28200 Annealed 96HRB 24,000


TGS Result for Selected Dissimilar Stainless Steel on Same Condition [5] p.1473 Table 11

Condition & Hardness* S41000 S31600 S17400 S21800
Tempered (38HRC) S41000 3,000 2,000 3,000 50,000
Annealed (81HRB) S31600 2,000 2,000 2,000 38,000
Aged (84HRB) S17400 3,000 2,000 2,000 50,000
Annealed (94HRB) S21800 50,000 38,000 50,000 50,000

* Condition and hardness apply to both horizontal and vertical axes.

 TGS Result for Selected Dissimilar Stainless Steel on Different Condition [5] p.1474 Table 13

Stainless Steel vs Stainless Steel Threshold Galling Stress

[PSI]

S30400 (77HRB) vs S17400 (33HRC) 2,000
S31600 (82HRB) vs S31600 (27HRC) 8,000
S41000 (42HRC) vs S45000 (43HRC) 1,000
S41000 (42HRC) vs S42000 (50HRC) 3,000
S28200 (96HRB) vs S28200 (35HRC) 15,000
S28200 (96HRB) vs S45000 (29HRC) 8,000
S21800 (95HRB) vs S17400 (33HRC) 50,000
S21800 (95HRB) vs S42000 (50HRC) 50,000


Despite of material limitation against galling, there are several ways to prevent this failure on thread joint, such as:

  1. Use lubrication where ever possible.
  2. Proper thread machining process with good roughness definitely will discourage galling failure. It is said the smooth surface lack the ability to store wear debris. Hence, it will increase thread contact area (less stress on parts) and prevent interlocking on rubbing surface.
  3. Prevent any similar stainless steel material combination. As being explained earlier, self-mating material shall only accelerate galling failure. Using dissimilar stainless steel with different atomic structure offer beneficial effect as both materials have different work harden rate. Such literature or button-on-block test result might help to screen the best option of material combination.
  4. Provide enough clearance (groove) at the close clearance components. The clearance shall act to collect wear debris along the rubbing surface while keep both parts cool as it promotes rapid heat transfer.
  5. Coating on thread joint shall help to prevent galling failure especially during multiple make/break along lifetime service. Given no special circumstances, dry film lubrication (e.g. Xylan®) layer on female thread would be more preferable than male thread based on thread making process fact. Such coating like aluminum coat has beneficial effect to prevent galling at elevated temperature (1,200ºF).
  6. Modification on thread material heat treatment process to create hardness differences (some literature mention 50HBW gap). Such situations encourage wear on the softer material rather than galling mechanism.
  7. Hardness difference also might be obtained through surface hardening process. However, some of surface hardening process needs to be fully considered right before applied on stainless steel material such as nitriding. Nitriding definitely increases surface hardness and wear resistance while it decrease general corrosion resistance. (There are also some debate regarding nitriding on the thread as it will make thread tip harder (yet brittle) and prone to fracture when loaded at installation). Hence, nitriding process might not the best option given the corrosion resistance properties are of major importance.

Source:

  1. Greenslade, Joe, “New Compound Overcomes Stainless Bolt and Nut Thread Galling”, Exclusive Article for the American Fastener Journal, October, 18, 2002.
  2. ASTM G40-15, 2015, “Standard Terminology Relating to Wear and Erosion”, Annual Book of ASTM Standards, Vol. 03.02, ASTM International, West Conshohocken PA.
  3. ASTM G98-02, 2009, “Standard Test Method of Galling Resistance of Material”, Annual Book of ASTM Standards, Vol. 03.02, ASTM International, West Conshohocken PA.
  4. Budinski, Kenneth G. “Guide to Friction, Wear, and Erosion Testing”, ASTM Stock Number MNL56, 2007. ASTM International, USA.
  5. Blau, J. Peter, et. al., “Friction, Lubrication, and Wear Technology”, Vol 18, ASM Handbook®, ASM International, 1992,
  6. Davis, J.R. “Stainless Steel”, ASM International, 2001, ASM International, USA, p532.
  7. Arai, Tohru, et. al., “Heat Treating”, Vol 4, ASM Handbook®, ASM International, 1991, p908
  8. Davis, J.R. “Surface Engineering for Corrosion and Wear Resistance”, ASM International, 2001, ASM International, USA.
  9. wikipedia.org/wiki/Galling
  10. eng-tips.com/280053
  11. eng-tips.com/144638
  12. eng-tips.com/385586


Posted in Engineering | Tagged , , , , , , , , , , , , , , , , , , , , , , , , , , , , , , , , , , , , , , , , , , , , , , , , , , , | Leave a comment

History of API Casing Grade

casing_api_grade_timeline

Most people who work in upstream oil industry aware about casing and tubing as has been established under API Specification 5CT. There are twelve (12) casing grade mentioned at the latest API 5CT standard (9th Edition) started with ‘H’, the weakest up to ‘Q’, the strongest from mechanical yield strength perspective.

Initially, pipe casing grade was identified solely by letter which used for phonetic clarity reason. This idea was stemming from agreement between pipe special committee in 1938. It was agreed since that time to identify pipe grade with a combination of letter and numeral. Numeral value indicates specified minimum yield strength while letter was used for phonetic clarity reason. It was decided not to use letters which had not been used previously or were not used by any manufacturer to designate their pipe product.

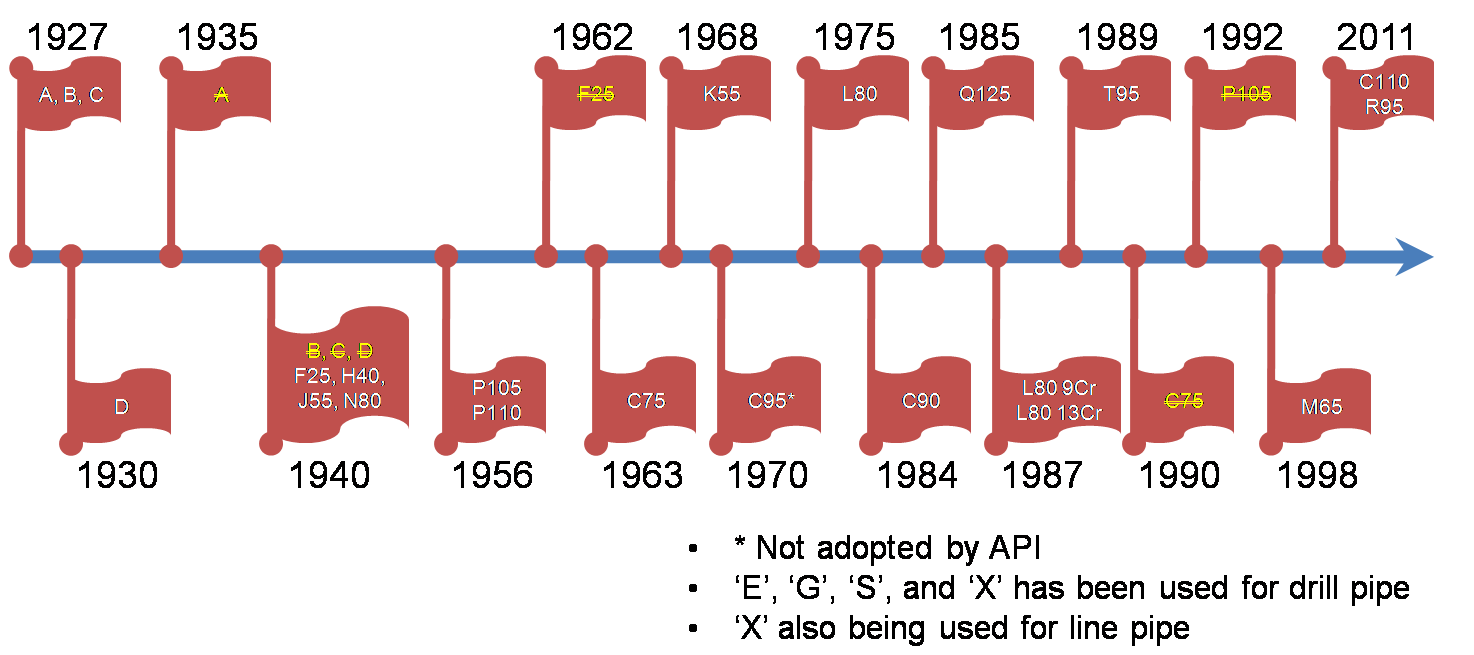
As the industry moving forward, hardcore demand creates new challenge. Several revisions also done on API specifications either removing or add new casing grade in order to align with industry application. However, this challenge was impact not only to manufacturer, but also to operator. One of the impacts was proposition to adopt new casing grade with used letter marking by some operator. The used letter was proposed with reason though it beats the phonetic clarity benefit of grading designation. Below are the summaries of API casing grade history.

Grade A, B, and C

The first three alphabetic letters were translated from low (30ksi yield), medium (35ksi yield), high carbon steel pipe (45ksi yield), respectively, which manufactured by seamless process in 1927. Another manufacturing process, Electric Resistant Welding (ERW) also permitted for this grade since the process was added to API Spec 5A in 1934.

Grade D

This grade was adopted in API Standard 5A since 1930 with 55ksi yield which became “the highest strength grade” that day to serve deeper well.

Grade F25, H40, J55, N80

Based on institute annual meeting decision in 1938, pipe grading system shall incorporate letter and number. It was agreed to use letters which hadn’t been used previously or weren’t use by any manufacturer to designate any pipe, which would be distinguishable readily when stamped on the pipe with a steel die and had no resemblance in sound to each other. The next grade was named F25, H40, J55, and N80. Most likely, ‘I’ letter wasn’t used due to obvious reason mentioned earlier.

J55 was adopted to replace the existing grade D even it has lower tensile strength properties (75k) with consideration it could be furnished with by seamless or ERW process.

In 1940, grade F25 was removed due to economic consideration since it costs similar with next higher grade (H40). Higher strength with higher performance would be preferable in price manner.

Grade P110 & P105

In 1956, new higher casing grade P110 was included in API Standard 5A. In 1960, P110 was taken from API Standard 5A and was incorporated into new API tentative standard 5AX along with P105 tubing.

Initially, higher strength 110k yield on both casing tubing was demanded by user. However, manufacturer had some difficulty to produce 110k yield for tubing that time. Hence, it was decided P grade on tubing come with 105k yield. Along with advance manufacturing technology and as requested by API user member, P110 also being done in tubing, and P105 grade was deleted in 1992 from API Spec 5CT.

Grade C75

In late 1950, more challenge was driven by one particular user member as they need to secure the casing for sour service well. It was known that casing/tubing need to have maximum 22HRC for sour service even up to this moment.

While the Q&T process were not available from manufacturing technology side at that time, another casing grade C75 as a modification of N80 tubular with normalized and tempering (N&T) ‘hardness controlled’ was produced. Those reason also become the philosophy behind API Tentative Standard 5AC creation. Along with this case, other user member also started to be warned for using P110 or P105 grade as those high strength casing are prone to sulphide embrittlement.

Grade K55

In 1968, it was reported that actual tensile seamless J55 grade always exceed 95k, more than minimum tensile strength of grade D drill pipe. Some proposition was offered to API for updating the J55 minimum tensile strength specification to 95k. API decided to come up with a new grade K55 considering 95k tensile properties on J55 were difficult to achieve by ERW process.

Grade C95

The grade was proposed by one user member as they mention it was better than existing grade C75 for mild sour service with 95k yield. However, this particular grade wasn’t adapted to API standard while many users also oppose this adoption since it’s not suitable for severe sour service.

Grade L80

As the advance of manufacturing process quench and temper (Q&T) technology and requested by many user members to raise the minimum 75k yield strength requirement for sour service, new grade L80 was born and became the current accepted grade for sour service replacing C75. Another variant of L80 with 9Cr and 13Cr was adopted in 1987.

Grade C90

In 1984, the user member insisted to use the letter ‘C’ for new 90ksi restricted yield strength to show better performance against C75 for similar sour service application. The benefit of name clarity was lost due to adoption of this grade (later on C75 was removed in 1990 which high likely to keep maintain name clarity benefit).

Grade Q125

This grade was adopted in 1985 to meet general service grade for deeper well.

Grade T95

In 1989, this grade was adopted by API for severe sour service requirement. The letter was selected to prevent name confusion with existing 95k yield grade (C95). It has more stringent quality control in a similar manner like C90 with 25.4HRC maximum hardness.

Grade M65

Another variant grade was adopted by API which not used so often. This is the only steel grade among general service with controlled maximum hardness.

Grade R95

This grade adopted by API with the same strength as T95 without hardness requirement which intended not for sour service.

Grade C110

As being driven by NACE MR0175-98 which addressed minimum 100k, 105k, and 110ksi yield strength tubular grade, this new casing grade finally being adopted by API in 2011 for sour service after numerous test. Special concern for proper controlled metallurgical attributes needs to be taken when using this particular grade.

Source:

  1. Dunlop, C.A.: “Trend and Developments in API Standards”, paper API-39-361 presented at spring meeting, Southwestern District, Division of Production, San Antonio, Texas, Mar 1939.
  2. Thomas, P.D.: “Steels for Oilwell Casing and Tubing – Past, Present, and Future”, paper SPE 527 presented at 92nd Annual AIME meeting, Dallas, Texas, USA, Feb 24-28, 1963.
  3. Speel, Lutz: “High Pressure Gas Well Completion”, paper WPC-12243 conference, 1967
  4. Bartlett, L.E., et al.: “Activities of the API Committee on Standardization of Tubular Goods”, paper SPE 20814 first presented at Offshore Technology Conference held in Houston, May 7-10, 1990.
  5. Jones, W.T.; N. Dharma: “Standardisation of Tubular Goods for Worldwide Application”, paper SPE 25328 presented at SPE Asia Pacific Oil and Gas Conference in Singapore, 8-10 February 1993.
  6. Economides, Michael J. et al., Petroleum Well Construction, John Wiley & Son, Ltd. 1997
  7. Urband, bruce E.: “High Strength Sour Service C110 Casing”, paper SPE/IADC 52843 presented at 1999 SPE/IADC Drilling Conference held in Amsterdam, Holland, 9-11 March 1999.
  8. Casner Engineering Service, “The History of API OCTG Grades”, November, 6, 2005.
  9. Urband, Bruce E.: “High Strength Sour Service C110 Casing”, paper SPE/IADC 52843 presented at 1999 SPE/IADC Drilling Conference held in Amsterdam, Holland, 9-11 March 1999.
  10. Chelette, K.D., et al.: “Management of Residual Stress: An Emerging Technology for Oil Industry Tubular Products”, paper OTC 22760 presented at Offshore Technology Conference Brazil held in Rio de Janeiro, Brazil, 4-6 October 2011.
  11. API Specification 5CT 9th Edition, 2011. Specification for Casing and Tubing.
  12. sovonex.com/drilling-equipment/api-casing/api-5ct-casing-grades/ (accessed at February, 13th, 2016).
Posted in Engineering | Tagged , , , , , , , , , , , , , , , , , , , , , , , , , , , , , , , , , , , , , , , , , , , , , , , , , , , , , , , , , , , , , , , , , , , , , , , , , , , , , , , , , | Leave a comment

Reinhold-Spiri Equation

reinhold-spiriNowadays, oil and gas operator continually deepen the casing setting depth to reach the well target. These trends have created various operational and well design challenges. One of the challenges lies in the limited capacity of suspended drilling and landing string slip based handling system due to slip crushing failure.

This particular failure in the contact area between drill pipe and slips was first addressed by Reinhold and Spiri in 1959. They presents essential physics relationship between the axial load (FA) on the pipe and the transverse force (FR) created by the slips thereby calculating the slip crushing load where the slips can cause yielding in the pipe. Slip crushing equation derived based on the physical phenomenon that the tubular collapse capacity will decrease with increasing axial load.

The slips act as a wedge to hold the pipe and exert bi-axial loading on the pipe (FA & FR). By having a transverse load factor (K), the axial and average radial stress (Sa and Sro) can be determined from these biaxial load.

Once the slips are set around the tubular, it will exert transverse load to the pipe which converted into hoop stress (Sh). Hoop stress could be determined from Lame equation for thick wall cylinder considering this particular stress applied to the slips as well (slips considered as thick walled hollow frustum cone) . Knowing the primary stress act on the pipe, the Von Mises Equivalent (VME) stress criterion can be used to estimate the axial load at which the pipe internal diameter (ID) begin to yield. More detailed derivation on calc_006.

Source:

  1. Johnson, Rick, et al.: “Tri-axial Load Capacity Diagrams Provide a New Approach to Casing and Tubing Design Analysis”, paper SPE 13434, first presented at the 1985 SPE/IADC Drilling Conference held in New Orleans, March 6-8, 1985.
  2. Hayadavoudi, A.: “Elastic Yield of Casing Due to Elevator/Spider System”, paper SPE/IADC 13449 presented at the SPE/IADC 1985 Drilling Conference held in New Orleans, Lousiana, March, 6-8, 1985.
  3. Sathuvalli, U.B., et al.: “Advanced Slip Crushing Consideration for Deepwater Drilling”, paper IADC/SPE 74488 presented at the IADC/SPE Drilling Conference held in Dallas, Texas, USA, February, 26-28, 2002.
  4. Paslay, Manatee, et al.: “A Re-examination of Drillpipe/Slip Mechanics”, paper IADC/SPE 99074 presented at the IADC/SPE Drilling Conference held in Miami, Florida, USA, February, 21-23, 2006.
  5. Brock, James N., et al.: ”2 Million-lbm Slip Based Landing String System Pushes the Limit of Deepwater Casing Running”, paper OTC 18496 presented at the 2007 Offshore Technology Conference held in Houston, Texas, USA, April 30 – May 3, 2007.
Posted in Engineering | Tagged , , , , , , , , , , , , , , | 18 Comments

How to Determine O-Ring Static Friction by using Nomograph

O-Ring_nomenclature

O-Ring is a torus shape mechanical element primarily used for sealing purpose. It is widely used at fluid power system where pressure isolation needed between shaft & cylinder mechanism, both for static sealing (no relative motion between parts & O-Ring) or dynamic sealing with relative motion between shaft & cylinder.

As it being confided between two harder mechanical members (shaft & cylinder), there’ll be some friction between O-Ring and bearing surfaces, either static or dynamic friction.

There is an easy nomographic method (calc_005) to quickly estimate both dynamic and static friction of O-Ring based on differential pressure and squeeze parameter. Static friction is a friction load needed to initiate motion or break adhesion between O-Ring and mating surface in static application. On the other hand, dynamic friction is a friction occurs between O-Ring and mating surface for dynamic sealing application which may wear the metal parts. Another thing worth to know is about system hysteresis, comparison between dynamic or static friction against hydraulic force. System hysteresis value expected to be minimum for dynamic application.

Source:

– Product Engineering magazine, June 1979, page 56

Posted in Engineering | Tagged , , , , , , , , , , , , , | Leave a comment

2014 in review

The WordPress.com stats helper monkeys prepared a 2014 annual report for this blog.

Here’s an excerpt:

A San Francisco cable car holds 60 people. This blog was viewed about 1,100 times in 2014. If it were a cable car, it would take about 18 trips to carry that many people.

Click here to see the complete report.

Posted in Ideas | Tagged | Leave a comment

Cladding on Wellhead Equipments

cladding

Cladding is a technique used to improve the service life of wellhead components by depositing corrosion resistant material (metallurgical bonded) to combat corrosive environment.

Majority of wellhead components are using low alloy steel (i.e. AISI 4130) which has excellent mechanical properties but poor corrosion properties. On the other hand, CRA materials (i.e. Alloy625) are known for corrosion properties with mechanical properties lower than low alloy steel. While CRA material has excellent performance under corrosive environment, it’s prohibitive to use entire component made of CRA due to cost constraint. Apart from this fact, cladding offer alternative strategy for cost effective solution with combination of excellent mechanical properties of low alloy steel with excellent corrosion properties of CRA, especially on fluid exposed area.

There are two common materials widely used for cladding on wellhead equipment, 316L and Alloy625. 316L is an austenitic stainless steel grade material which predominantly used as cladding material back then. The “L” letter after stainless steel code indicates low carbon grade which provide extra corrosion resistance after welding. Currently, Alloy625 become more prevalent to be used as cladding material though it’s not entirely replacing the 316L application. The reason of this demand change stemming from different Pitting Resistance Equivalent Number (PREN). 316L has PREN value 22.6-27.9, while Alloy625 has PREN value 36.7-39.2. Higher PREN means more resistant the material is to corrosion and pitting.

In most cases, the minimum cladding thickness after machining is 1/8” [3mm]. There is no specific reason why the common thickness being made in that value. It’s more like a result between economic and empirical data. Another possible reason could be based on corrosion allowance. Some international standard clearly mention cladding thickness (i.e. NORSOK M-630), but some doesn’t.

A number of different methods have been used to manufacture metallurgical bond, such as weld overlay, hot iso-static pressing (HIP), strip cladding, or explosive bonding. Weld overlay is the most popular method for cladding considering cost, manufacture lead time, and feasibility to deposit clad material under varying sections and small internal diameters. High deposition rate, low dilution, and low heat input are ideal characteristics of weld overlay process.

However, there’s none welding technique that could accommodate all those expected characteristics at once. Nowadays, weld overlay technique used dominantly (probably the preferred method so far) was done by Gas Tungsten Arc Welding-Pulsed (GTAW-P) hot wire where filler metal being heated prior to reach molten weld pool. Several advantages might be obtained with this method, such as: increased deposition rate by pre-heating the filler metal and low heat input by pulsing the input current. More advantage might be obtained by making it in automatic process as it offers very repeatable process with little to no defects. The only setback associated with this method is a slow process.

Another important thing on cladding is about dilution. Dilution is the mixing of filler with base metal through weld penetration. Dilution level normally expressed as percentage of base metal in the final weld metal. API Specification 6A limits dilution percentage of cladding process on wellhead equipment in terms of iron (Fe) %. As the cladding process done on wellhead equipment, in many cases, the first medium of cladding weldment will be exposed to hydrostatic test fluid which probably contains chloride (Cl). Hence, by limiting iron (Fe) content, it helps to prevent formation of ferric chloride (FeCl3) that could lead to pitting or crevice situation.

Figure 1 - Weld Overlay Dilution Limit (Adapted from [9])

Figure 1 – Weld Overlay Dilution Limit (Adapted from [9])

Source:

  1. Gottlieb, Theodore; Mann, Tarlochan: “Fatigue Analysis of Clad and Unclad Thick Wall Structures”, Paper OTC 4152 presented at the 13th Annual OTC in Houston, Texas, USA, May 4-7, 1981.
  2. Koshy, P: “Alloy 625 Weld Cladding of Wellheads and Valves: Review of Dilution-Control Techniques and Weld Process Development”, Paper OTC 4973 presented at 17th Annual OTC in Houston, Texas, May 6-9, 1985.
  3. Sisak, W.J.; Gordon, J.R.: “Laboratory and Field Evaluations of Clad Christmas Tree Equipment”, Paper OTC 6071 presented at the 21st Annual OTC in Houston, Texas, May 1-4, 1989.
  4. Smith, L.M.: “Clad Steel: An Engineering Option”, Paper OTC 6911 presented at the 24th Annual OTC in Houston, Texas, May 4-7, 1992.
  5. Pendley, M.R.: “Meeting the Challenge of Extremely Corrosive Service: A Primer on Clad Oilfield Equipment”, Paper SPE 25345 prepared for presentation at the SPE Asia Pacific Oil & Gas Conference & Exhibition held in Singapore, 8-10 February 1993.
  6. Smith, L.M.; Jordan, D.E.: “Ensuring Corrosion Properties of CRA Welds Meet Requirements for the Oil & Gas Industry”, Paper NACE 03091, USA, 2003.
  7. Huff, Phillip A.; Khandoker, Shafiq; Landthrip, Greg; Newbury, Melissa: ”Base Material Considerations and the Selection of NACE Approved High-Strength Alloy Overlay for Use on HP/HT Exploration and Production Equipment”, Paper OTC 19548 presented at the 2008 OTC held in Houston, Texas, USA, 5-8 May 2008.
  8. Berridge, David R.: “Corrosion-Resistant Alloy Cladding of Subsea Components”, Paper OTC 21973 prepared for presentation at the Offshore Technology Conference held in Houston, Texas, USA, 2-5 May 2011.
  9. API Specification 6A 20th Edition, 2010. Specification for Wellhead and Christmas Tree Equipment.
Posted in Engineering | Tagged , , , , , , , , , , , , , , , , , , , , , , , , , , , , , , , , | 1 Comment